 Mini-TES browse images and graphs
mission specific
One or more browse images or graphs may be shown on Mini-TES detail pages in the Notebook. The images and graphs represent the archived data products, but are not the actual data products. They are described below.
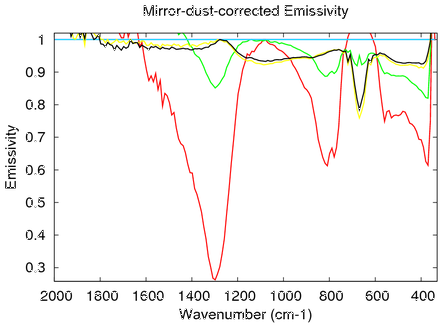
EDC and ESD Mirror-dust-corrected emissivity graph
Graphs of mirror-dust-corrected spectra are provided as part of EDC (mirror-dust-corrected emissivity) and ESD (emissivity standard deviation) Mini-TES products. The line colors in the graph are assigned arbitrarily. Graphs may be downloaded from Actions > Download on the detail page.
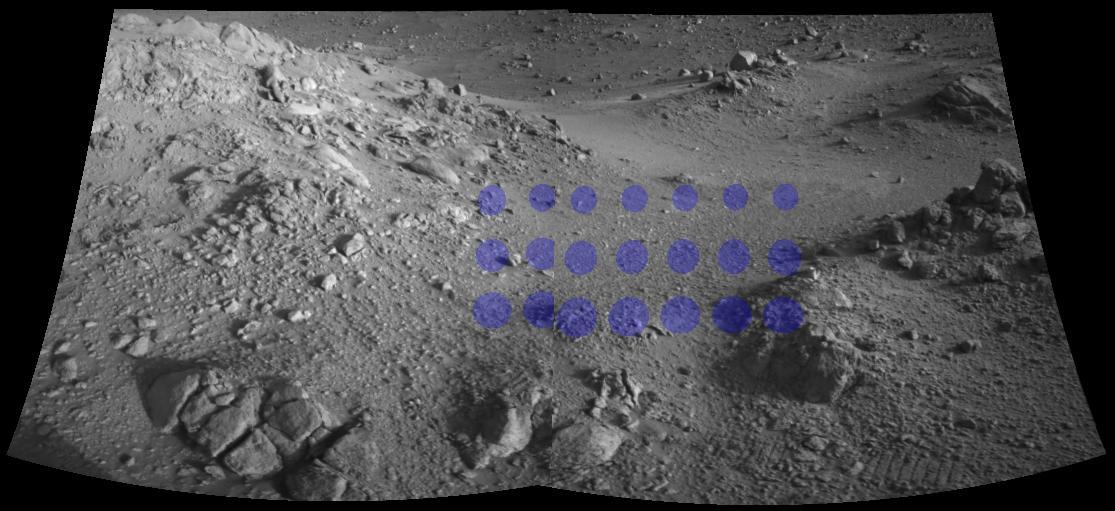
Mini-TES locator image
Many Mini-TES data products have an associated locator image in which blue overlays represent the locations of spectra acquired during the observation. In the case of multiple spectra, the top left spot in the overlay represents the first spectrum in the observation. Subsequent spots are related to spectra in column major order from left to right, top to bottom. Locator images may be downloaded from Actions > Download on the data product detail page.
BTR, EMR, and RDR graphs
Data plots are shown for BTR (brightness temperature), EMR (spectra emissivity), and RDR (reduced data record) data products. The graphs shown only the first 1000 data points of a particular product. Hovering the mouse over a data point shows the values for that point. An example graph is show here:
